
Ninety-five Years Ago
Surprising comparison between today's economic structure and that prevailing during enactment of Smoot-Hawley tariffs in 1930.

Next month will mark the 95th anniversary of the enactment of the Smoot-Hawley Tariff Act, widely viewed as the spark to a global trade war and a major contributing factor to the Great Depression. As many have noted, during the first 100 days of Trump 2.0, US tariffs have surged above rates hit in June 1930, when US President Herbert Hoover signed the SHTA . What lessons can we glean from that earlier period that might bear critically on what lies ahead?
Unsurprisingly, the current structure of major economies is very different today than it was back then. For the United States, this can be seen through the forensic lens of US Commerce Department statisticians who have reconstructed the national income and product accounts back to 1929. The table below compares the basic components of US GDP between then and now, underscoring key structural shifts which are especially pertinent in assessing what might lie ahead. Three key conclusions are evident:
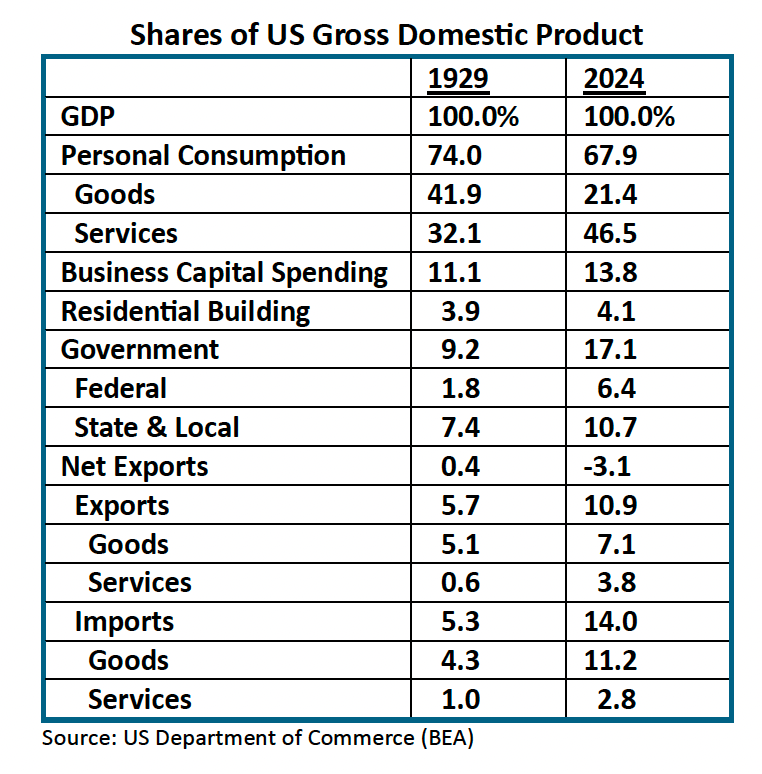
Personal consumption. The United States has long had a consumer-led economy. While the still dominant personal consumption share of US GDP has fallen somewhat over the past 95 years, there has been a dramatic shift in the mix of consumer demand. Today, the goods consumption share of the economy is about half what it was back then. The dramatic surge of services consumption has been nearly offsetting, consistent with the modern trappings of what John Kenneth Galbraith’s dubbed in 1958 as America’s increasingly Affluent Society. The personal saving rate, measured in the national income accounts as a residual between personal income and spending relative to after-tax (disposable) personal income, was little different in 2024 (4.5%) than it was back in 1929 (4.7%); this is a somewhat surprising result considering the subsequent financialization of the US economy, which spawned the emergence of asset-based saving (especially homes and equities) as a potential substitute for more traditional forms of compensation- or income-based saving.
Government. On the eve of the Great Depression, total government purchases accounted for 9.2% of US GDP in 1929, with the Federal share just 1.8%. During the Great Depression, this became the focus of the public works “pump-priming” of Rosevelt’s “New Deal”, which led to nearly a four-fold increase in the Federal share to 6.8% by the end of the 1930s. Today’s 6.4% Federal share of GDP, while up over three-fold from that of 1929, is little different from the late 1930s. By contrast, the major share of the government’s footprint in the real economy has continued to come from the state and local sector, where purchases hit 10.7% of GDP in 2024, significantly higher than the 7.4% share of 1929.
Trade. Net exports — the difference between exports and imports — were basically in balance 95 years ago, in sharp contrast to the -3.1% deficit share of GDP in 2024. While today’s overall export share of GDP (10.9%) is nearly double that of 1929 (5.7%), an even bigger shift has come on the import side of the equation, with goods imports at 11.2% of GDP in 2024, nearly three times the 4.3% portion of 1929. This sharp increase in the import intensity of the US economy over the last 95 years is especially important in assessing the impact of Trump’s tariff hikes, which are now hitting a much broader segment of the US economy than was the case in the early 1930s. Back then, when global trade contracted a cumulative total of 65%, the goods import share of GDP fell by 47% from 4.3% in 1929 to 2.3% in 1932; if a similar contraction were to occur today, the import share could plunge to around 6% of GDP — underscoring the potential for sharp downward pressures on import-intensive domestic demand, especially personal consumption.
But that is only part of the story — there is far more to the foreign trade channel than can be seen through the national economic accounts. Global supply chains, which have changed the very concept of cross-border commerce, did not exist 95 years ago when the US and global economy were last consumed by a trade war. This is a very big deal. As Richard Baldwin, an IMD economics professor, has stressed, the development of global value chains over the past 30-40 years has led to a fragmentation of trade into components and parts that are ultimately assembled and distributed from entirety different platforms. Baldwin dubs this phenomenon an “unbundling” of producers from nation-states. This implies a resulting denationalization of global competition, which stands in sharp contrast to Trump’s view of trade as unfair, or “rigged,” battles between nation states.
In thinking about trade policy, it is important to disentangle supply chain impacts from traditional cross-border trade statistics. That is especially the case in light of concerns about the so-called China shock and its impact on the US economy — a major research focus of MIT economist David Autor and his associates that has been seized on by both Trump administrations. Specifically, we need to know how much of the China impact comes directly from production inside of China and how much comes from the value added by other nations who are responsible for the production of components and parts that are assembled in China and then shipped to the United States. Trade policy should be directed at correcting the imbalances of higher value-added production rather than lower value-added assembly and distribution.
The iPhone is a classic case in point. In 2024, Apple imported about $40 billion of iPhones from China — America’s single largest import from China; this figure, however, represents the total, or gross, value of these products when they leave China for the US. Yet, with iPhone components made from a number of other countries — Japan, Korea, Taiwan, and even the United States — the value added by Chinese producers and workers has been estimated at only around one-quarter of that total. Published trade statistics do not capture that important distinction — they allocate 100% of an import’s value to the nation from which the final product was shipped. In other words, China is being blamed as a proxy for all the other nations involved in the iPhone’s supply chain — Baldwin’s unbundled production process.
This is not just an iPhone story. The so-called TIVA data base of the OECD has been carefully constructed to capture broad supply-chain effects by measuring cross-border trade in value-added. The results are startling: in 2020, TIVA data suggest that only about 25% of gross output of China’s manufacturing sector reflects the value added by domestic Chinese production — well below shares of most major industrial economies.
Yet try telling that to Donald Trump and other protectionists who fixate on a distorted portrayal of the China shock as seen through the country-specific metrics of gross shipments of final products. By drawing on official trade statistics to single out China for extreme tariff actions — like the 145% tariffs currently in place (which, for now, exclude iPhones) — China is being penalized as an assembler, ignoring the higher value-added supply-chain contributions of others. This is a serious shortcoming of the Trump Administration’s broader tariff policies. Other than minor exemptions for auto parts and some USMCA trade flows, the new tariff regime fails to make critical distinctions up and down the value chain — between production, assembly, and distribution.
All this underscores the perils of Trump’s trade war. He is putting tariffs on goods imports that currently account for over two and a half times the share of US GDP then was the case when Smoot-Hawley tariffs were enacted with devastating consequences in 1930. And he is taxing imports at their gross value, which makes no allowance for the modern supply-chain effects that distort official trade statistics. Trump’s tariffs, in effect, turn back the clock by driving a wedge between nation states, ignoring the supply chain efficiencies that have played such a powerful role in knitting a once fragmented world together. Deglobalization of a globalized world is likely to be a wrenching shock — hardly the benign “transition” that Trump suggests. Why should we believe that the coming global trade war will be any less disruptive than that which occurred ninety-five years ago?
This is another insightful and valuable analysis by Profesor Roach. He sheds light on an aspect I cannot remember having seen in recent assessments by other observers. Indeed, I share David Ginsburg's reaction, because I knew of the value added contribution of China from research I had read several years ago, but forgotten in the meantime.
In regard of Professor Roach's findings, it seems to me that simple mindedness, rather than simplicity of concept, is guiding the US administration's actions.
For this reader, Stephen Roach’s article, Ninety-five Years Ago, was an epiphany - one of those moments when you slap your forehead, saying to yourself “of course. Why haven’t I been thinking of value added chains within and across international borders, and China as an assembler of 75% of the components and parts in the finished products it exports.” In retrospect, it was such an obvious question to have asked, but didn’t. At least for a dunderhead like me.