
Affordability for Dummies
A primer on America's most contentious economic issue.

America has an affordability problem. Just as it spelled serious political trouble for Joe Biden, the same is now the case for Donald Trump. In June 2024, I argued in a piece for Project Syndicate that affordability was “The Defining Economic Issue of the US Election.” When Biden passed the baton to Kamala Harris, she struggled with that same problem.
Unsurprisingly, US voters rendered a similar verdict on November 4. This time, the shoe was on the other foot. Democrats trounced MAGA Republicans in three statewide elections (Virgina, New Jersey, and California), won or narrowed the gap in a large number of stunning local elections across the country, and held on to a key judicial majority in a critical swing state (Pennsylvania). The major polls pinned the blame on the state of the US economy, especially affordability.
The chart below updates my original effort to present the simple facts on affordability. The same facts make an equally compelling case today. The blue line is the overall price level as measured by the Consumer Price Index, indexed to January 2021 when Joe Biden’s term in office began. The red line is a monthly plotting of the year-over-year percentage change in the overall CPI, the so-called headline inflation rate. Yes, the headline inflation rate has receded sharply from its COVID-related spike of 9% in mid-2022, falling to a 2.3% low in April 2025; however, reflecting the persistence of positive, albeit subdued, inflation in the overall price level, the CPI index level has continued making record highs.
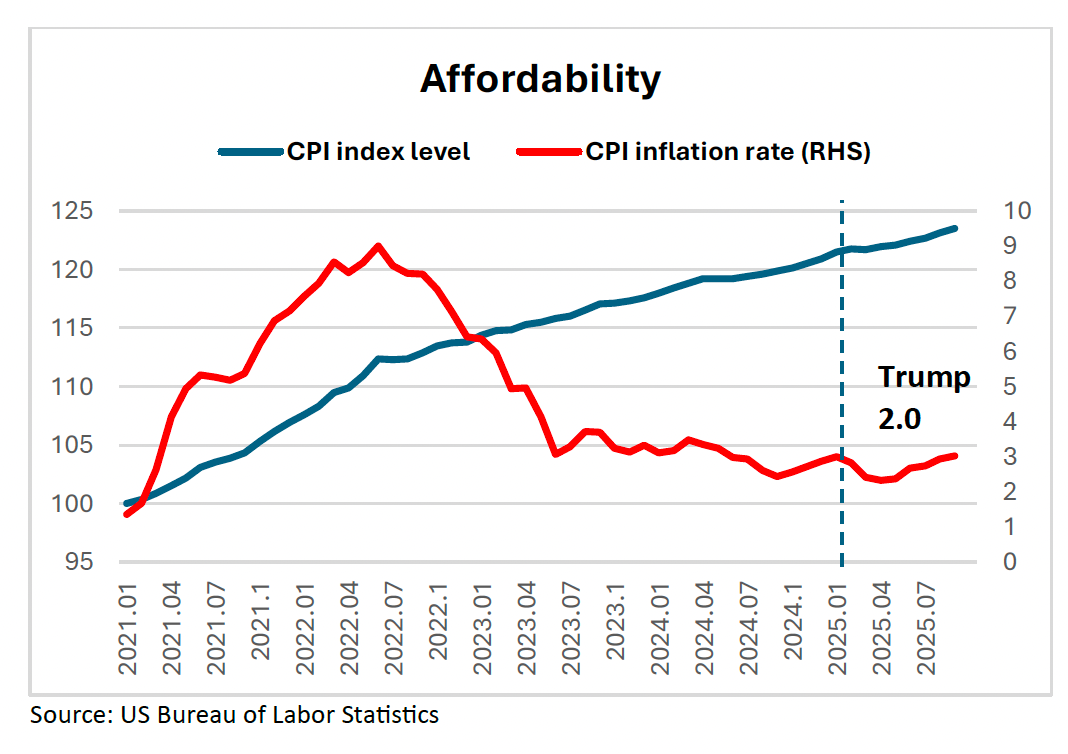
This is where politicians typically get into trouble. By focusing on the inflation rate, which has, indeed, receded dramatically from 2021-22, they are missing the key point in the current debate: Affordability is about the price level, not the rate of change of prices. Disinflation, or a decelerating rate of change in inflation is a good thing, especially for inflation-targeting central banks. But even in a disinflation, prices keep rising, providing no relief to the fundamental problem of pocket-book distress known as affordability. Moreover, with the lagged impacts of tariffs now largely responsible for most of the reacceleration of headline CPI inflation from the April low of 2.3% to the latest reading of 3.0% in pre-shutdown September, the price-level affordability issue is once again going from bad to worse. And these pressures are likely to persist, with further tariff-related increases still in the pipeline.
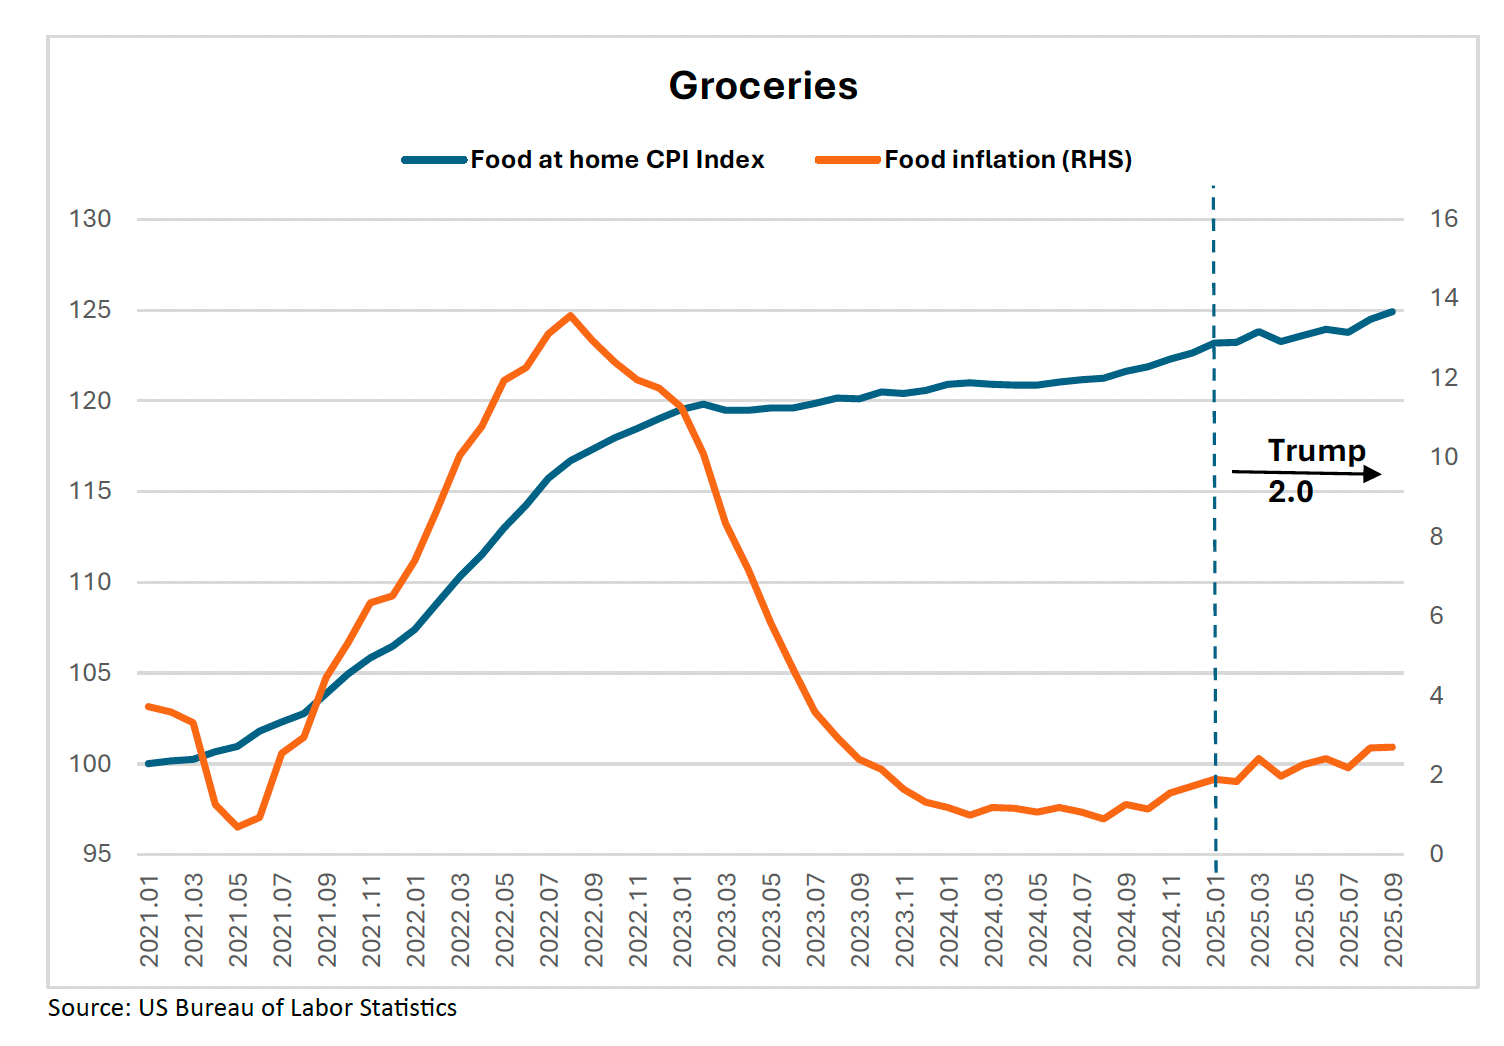
Consider the case of grocery prices, one of the key necessities of household spending where President Trump has a curious “old fashioned” fixation. As can be seen in the second chart below, the “food at home” category (aka groceries), which accounts for fully 8% of the total CPI basket, follows a pattern that is very similar to that shown in the first chart for the overall CPI. After peaking at 13.6% in the summer of 2022, the inflation rate for groceries (the red line) plunged to just +0.9% two years later. Meanwhile, the price level for groceries (the blue line), which flattened out at record highs earlier this year, has since resumed its climb into uncharted (unaffordable) territory on the heels of a re-acceleration of grocery-price inflation to 2.7% in September 2025. Despite these hard statistics, along with recent polling results on the unaffordability of groceries, this is at odds with the claim of Kevin Hassett, Director of Trump’s National Economic Council and one of the leading candidates for the next Fed chair; Hassett recently insisted, “Grocery prices are down significantly under Trump.” Maybe not!
This straight-forward way of looking at affordability — contrasting price levels with their rate of change — raises a number of questions. First and foremost is the risk of deflation — the only arithmetic way to reduce the economy-wide price level. The United States certainly doesn’t want to entertain a Japanese solution — a protracted decline its aggregate price level — to address its affordability problem. Could there be a more painless way out? In a recent television interview, Treasury Secretary Bessent suggested comparing CPI price levels with measures of household income to see if consumers could earn their way out of an affordability problem. However, with real disposable personal income in September 2025 still fractionally below where it was in January 2021, there is hardly a surplus of spendable inflation-adjusted consumer purchasing power that points to painless way out from America’s affordability trap.
There are, of course, a number of other ways to look at affordability, especially through the lens of disparities in the income distribution. The popular notion of a “K-shaped” US economy underscores the long-standing disparity between the rich and the poor, implying that affordability is “only” a problem for those at the lower end of the income distribution. The problem here, of course, is that wealth and income are becoming more concentrated at the extreme upper end of the US income distribution, broadening the incidence of affordability for the rest of the economy. That would suggest that my comparison between price levels and their rates of change is becoming even more relevant for an increasingly larger swath of the US population.
Finally, there is the possibility that disinflation masks significant shifts in the dispersion of inflation — shifting the mix of price increases away from necessities (i.e., food, medical care, shelter, and energy) that make up a disproportionate share of purchases at the middle and lower end of the income distribution toward discretionary purchases and luxuries that are favored by the wealthy. Inasmuch as there are always shifts in the mix of expenditures and prices, could these shifts be obscuring improvements in affordability? Data from the San Francisco Fed draw this point into serious question. Based on a careful examination of detailed statistics on personal consumption expenditures and prices, the SF-FED calculates that prices were rising for fully 89% of all household expenditures as of August 2025. In other words, shifts in the mix do not mask improved affordability.
All in all, there can be little wonder why affordability has become an increasingly intense issue of political debate in the United States. Unlike Joe Biden and Kamala Harris, who conceded the tough points on costs, prices, and affordability while stressing that “more action was required,” Donald Trump has stiffened in response to the recent election verdict. Vacillating between denial and blame, he is now claiming to be both the “affordability president” as well as a victim of Biden’s legacy. Dubbing the affordability issue as both a “con job by the Democrats” and a “hoax by the media,” he claimed that, “Every price is down … The affordability crisis is over ... I don’t want to hear about affordability.” Fact checking is hardly worth the effort in judging the veracity of these ridiculous claims.
President Trump’s comments are less about lying and his famous thin skin and more about his fundamental lack of understanding of basic economics. The charts above make the simple and obvious distinction between price levels and inflation. As any dummy can tell you, affordability is about high and rising price levels. There appears to be one important dummy who just doesn’t get it.